

Ghost Mode

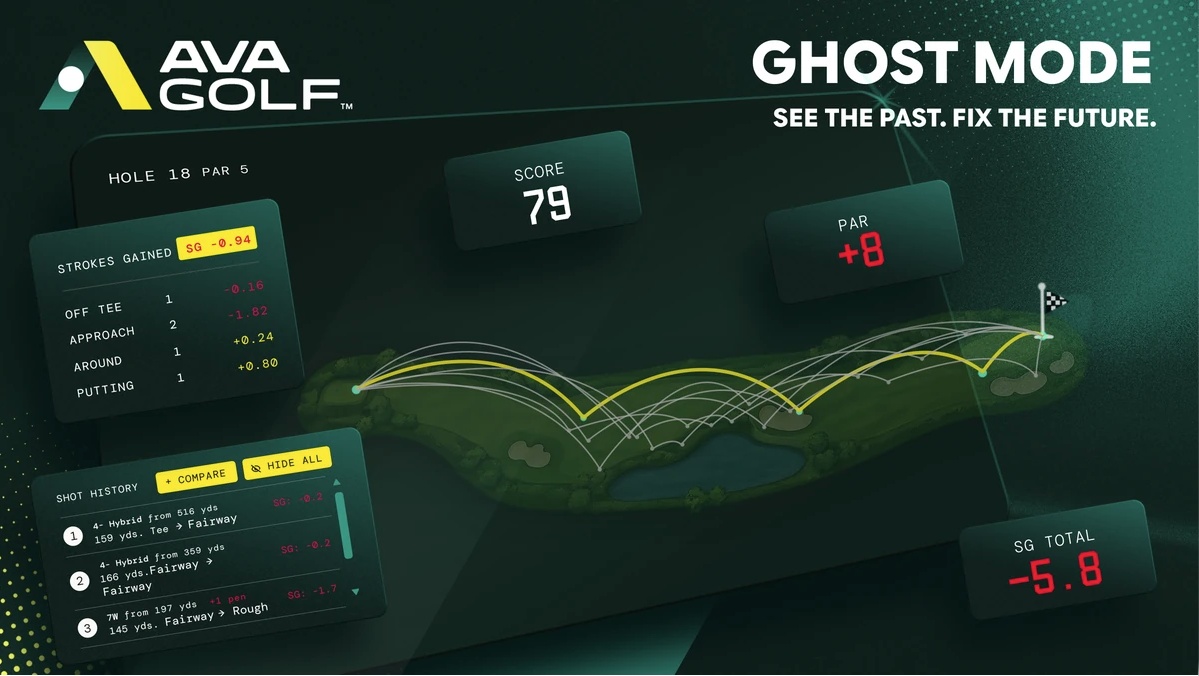
Ghost Mode layers every past attempt at a hole over the current one, so players see how they have played it before instead of reading one round at a time.
Tee shots that leak the same direction, approaches that finish short in the same spot — the habits that repeat on a hole surface as a picture rather than a number.
Copy Image EmbedDownload
<img
  src="https://brand.avagolf.com/brand/application/ghost-mode.webp"
  alt="AVA Golf Ghost Mode screen"
/>
Hole by Hole Outcomes

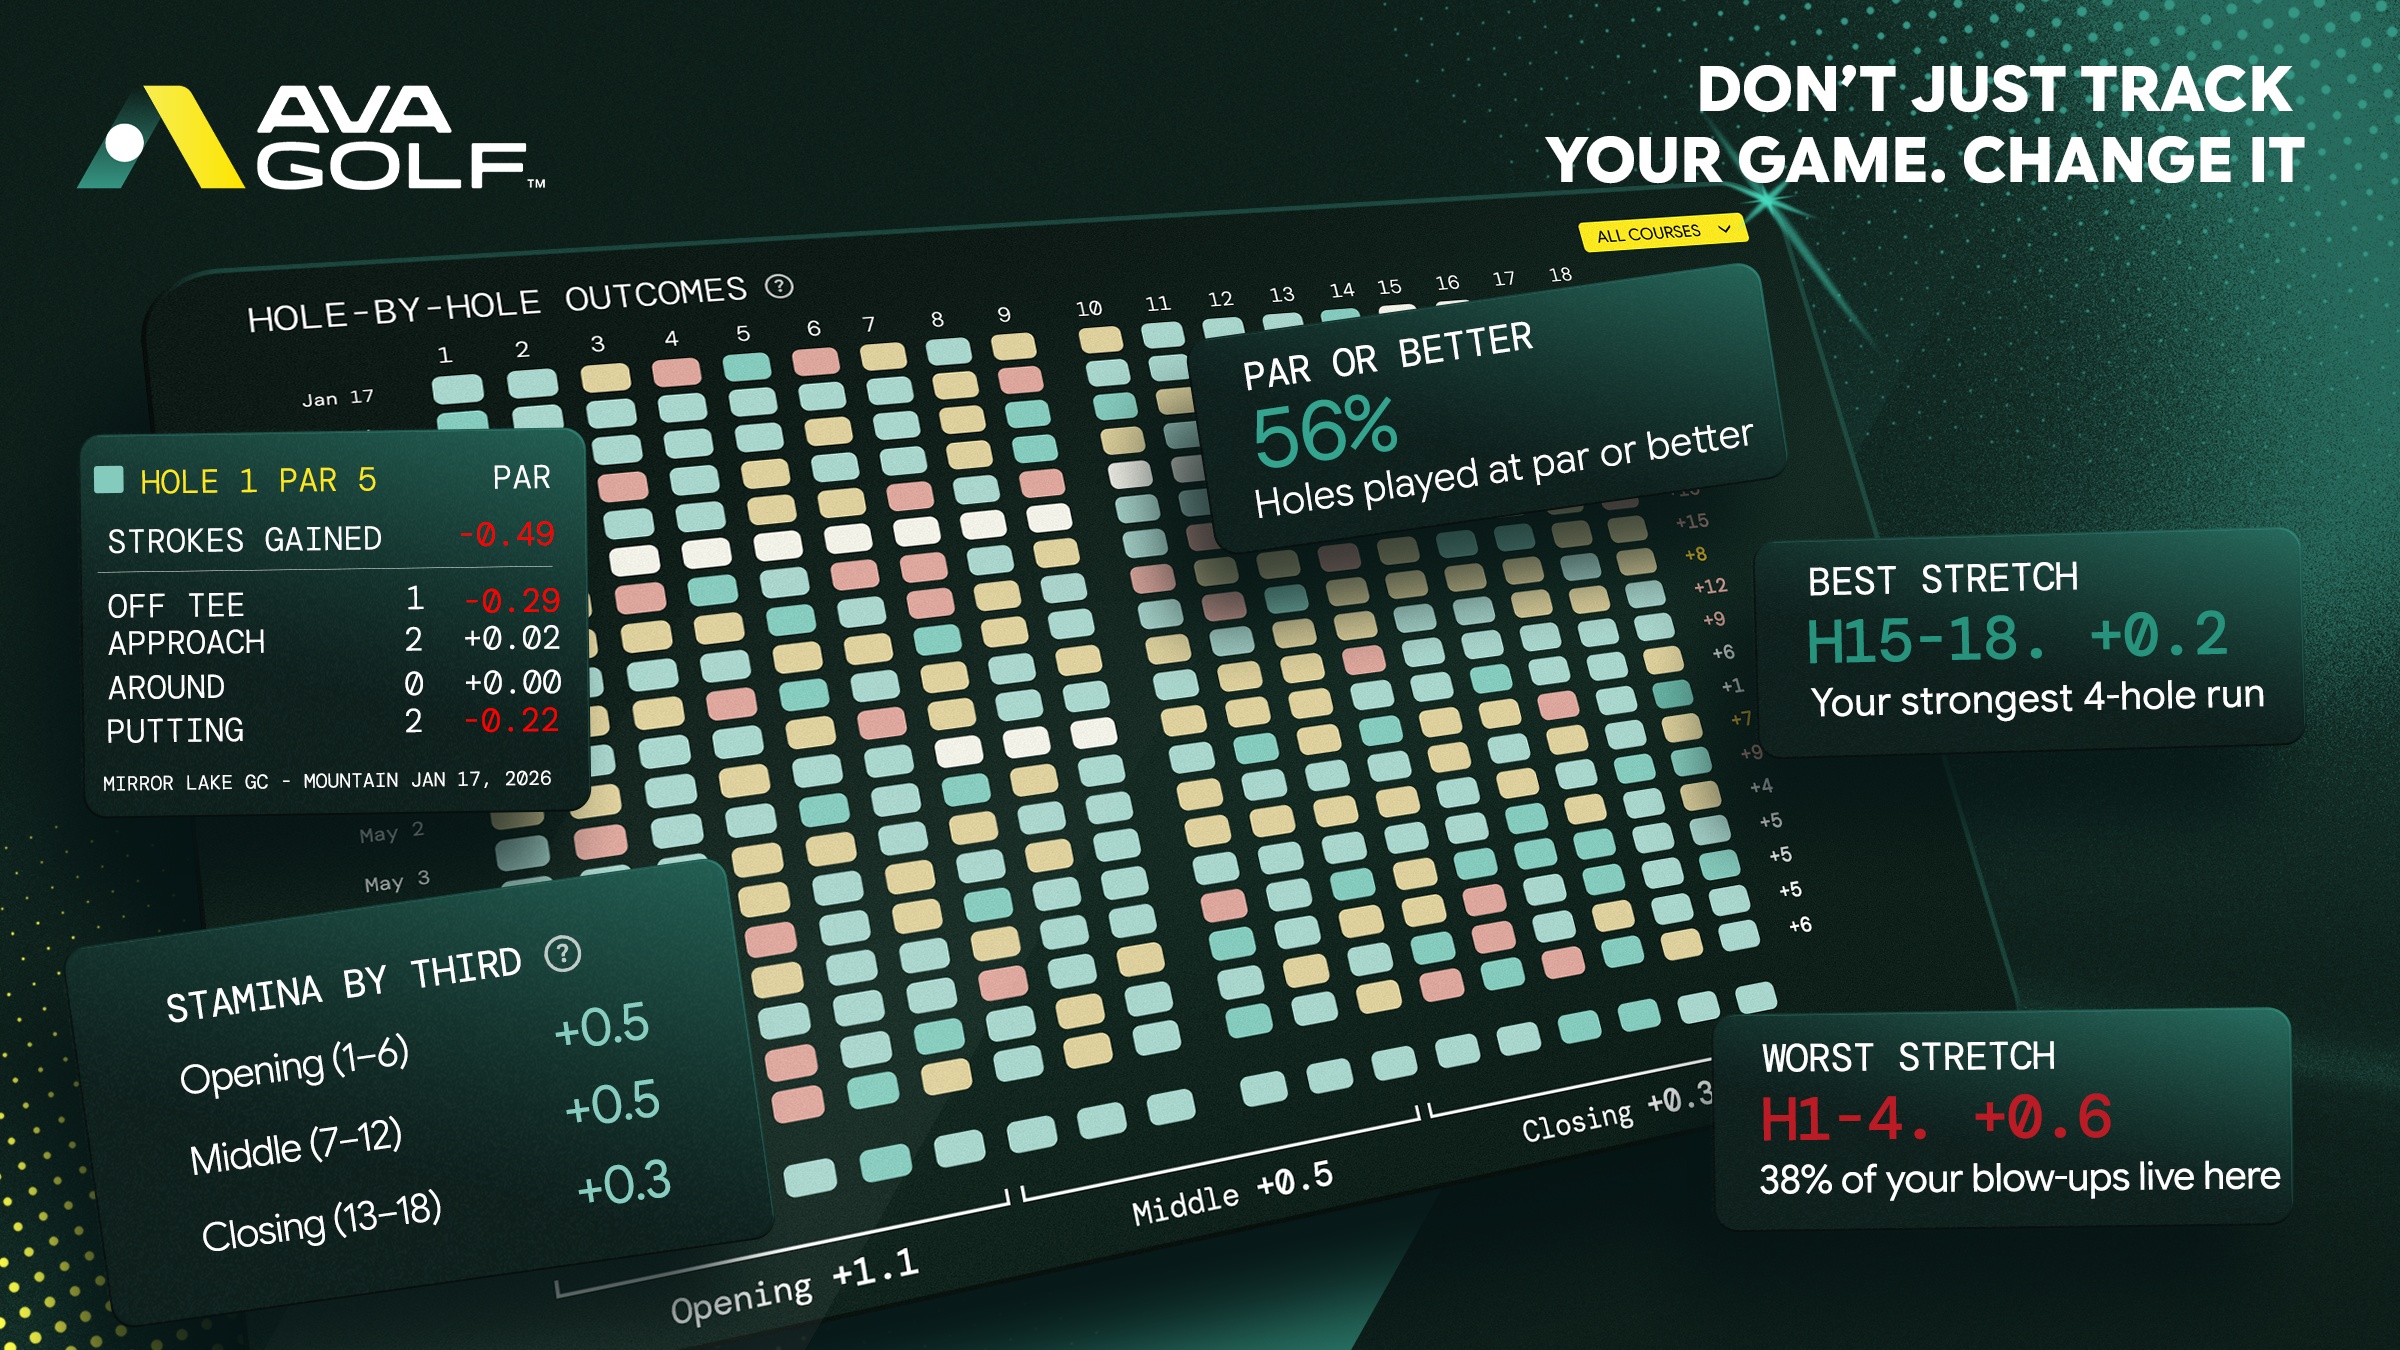
Every hole of every round, scored against par and laid out as a single grid — patterns surface here that no individual scorecard would reveal.
Stamina by third, best and worst stretches, and par-or-better rates show players exactly where their rounds are won and lost.
Copy Image EmbedDownload
<img
  src="https://brand.avagolf.com/brand/application/hole-by-hole-outcomes.webp"
  alt="AVA Golf hole-by-hole outcomes screen"
/>
Approach Dispersion Chart

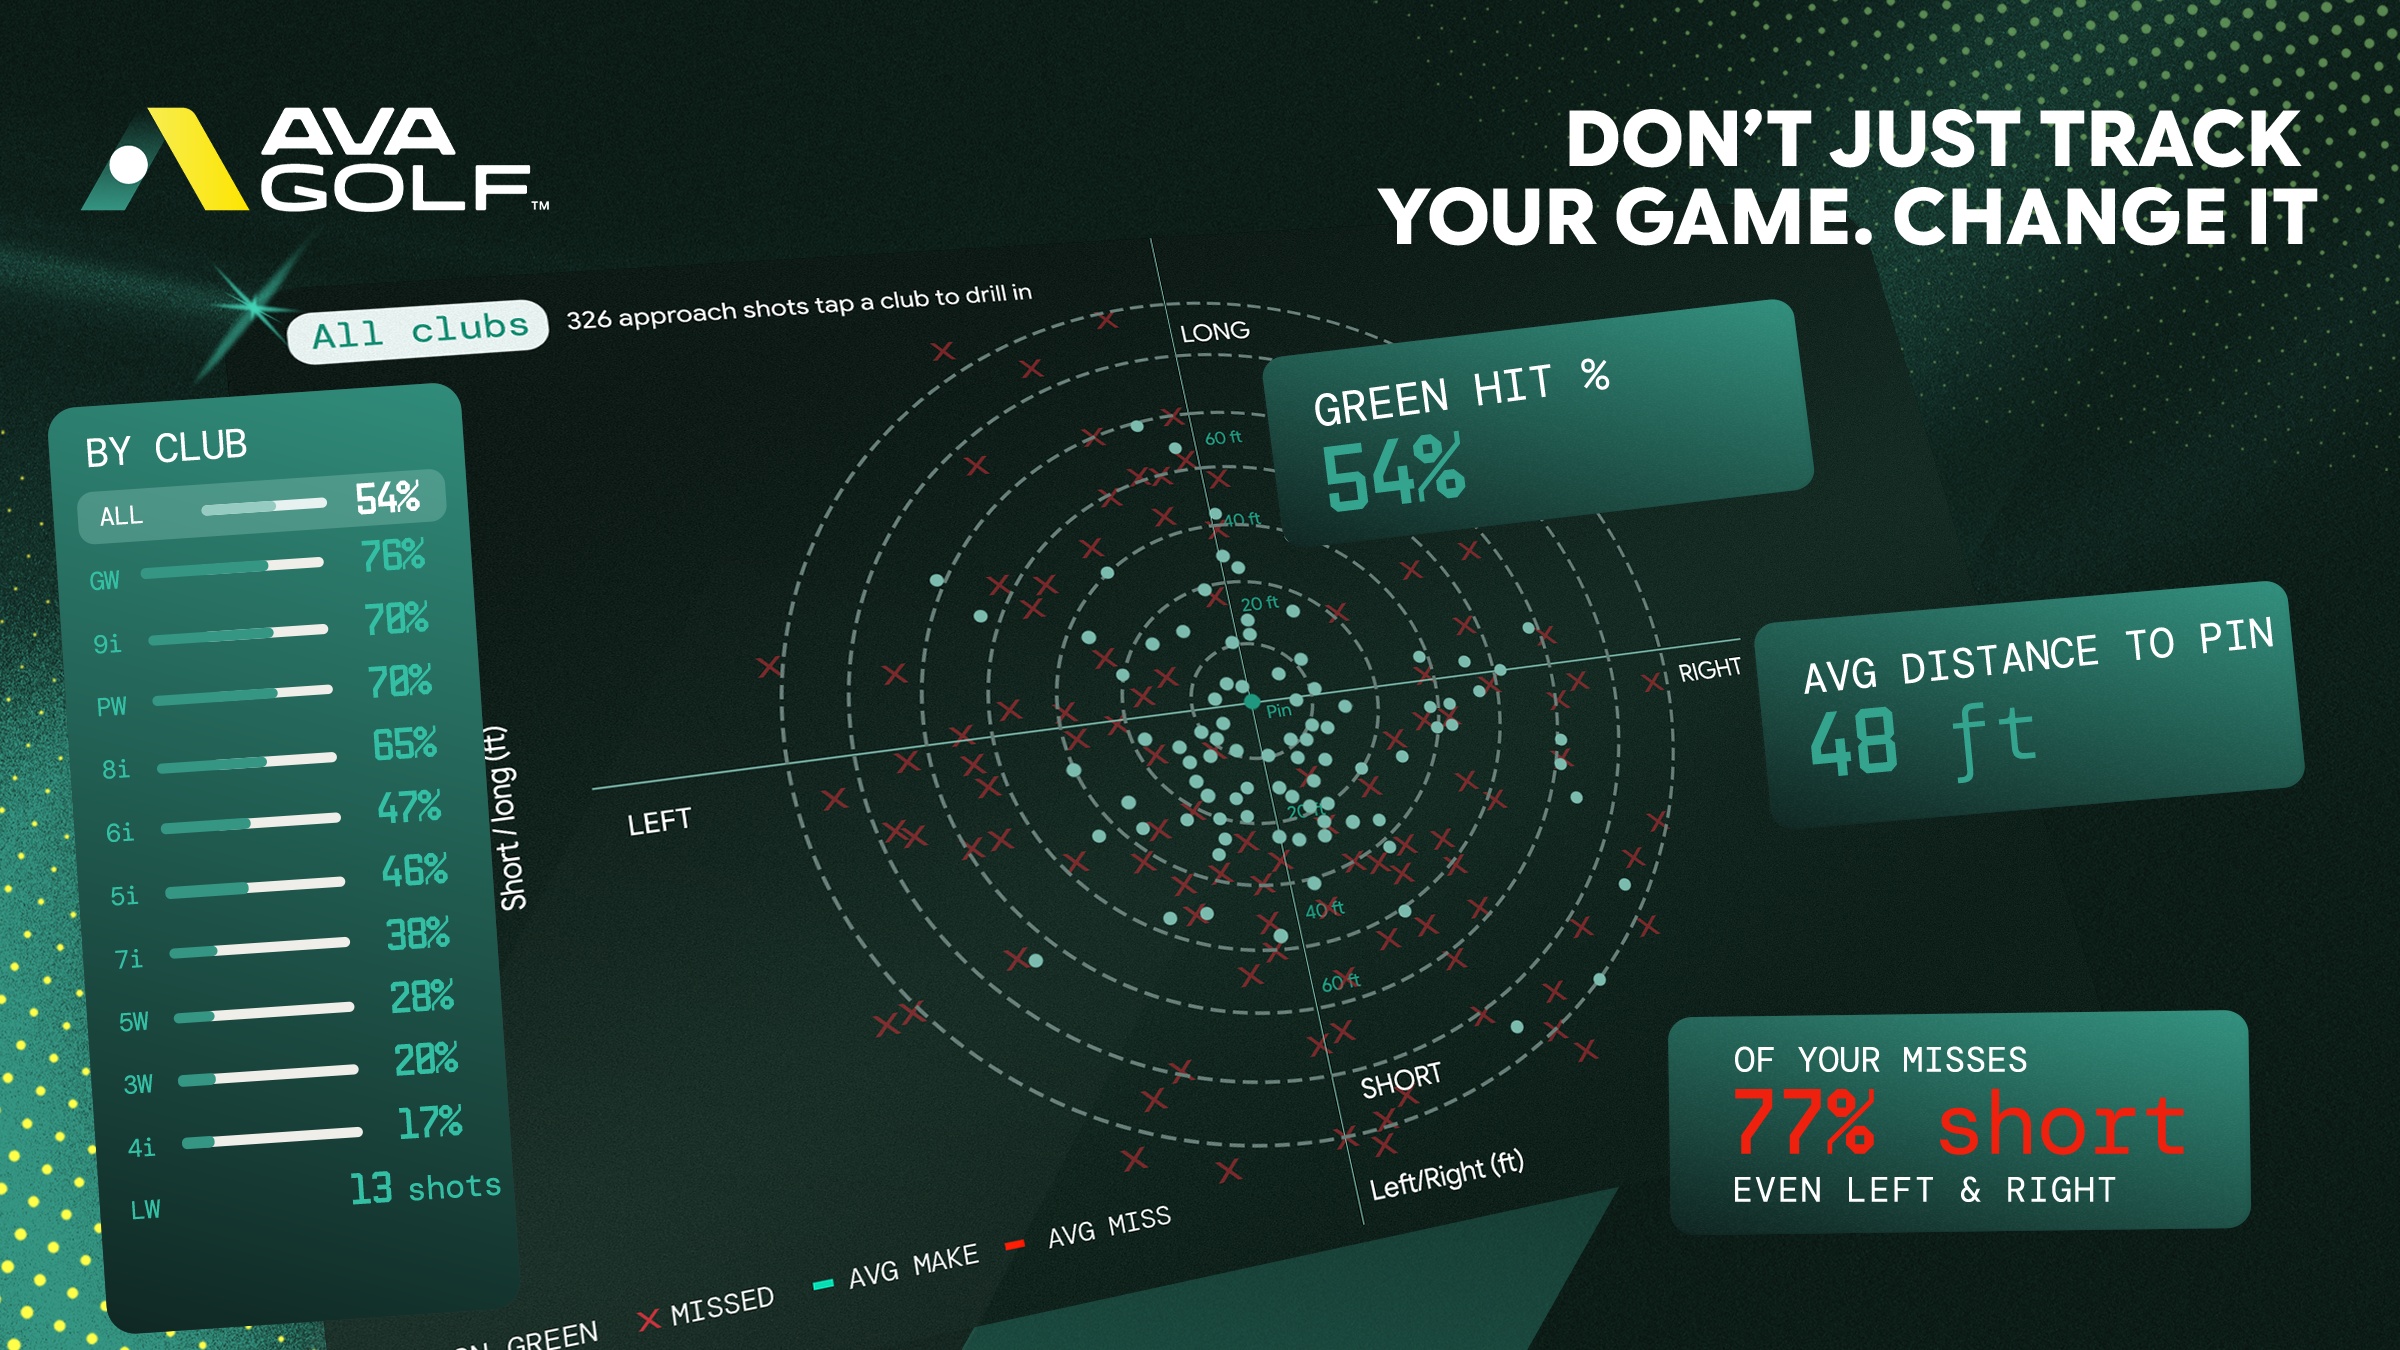
Every approach shot plotted around the pin — greens hit as dots, misses as X’s — so a season of scattered results resolves into one picture of where the ball actually finishes.
Green-hit rate by club, average distance to the pin, and the short-or-side bias behind every miss show players which yardages are quietly costing them shots.
Copy Image EmbedDownload
<img
  src="https://brand.avagolf.com/brand/application/approach-dispersion-chart.webp"
  alt="AVA Golf approach dispersion chart screen"
/>
Chip Landing Chart

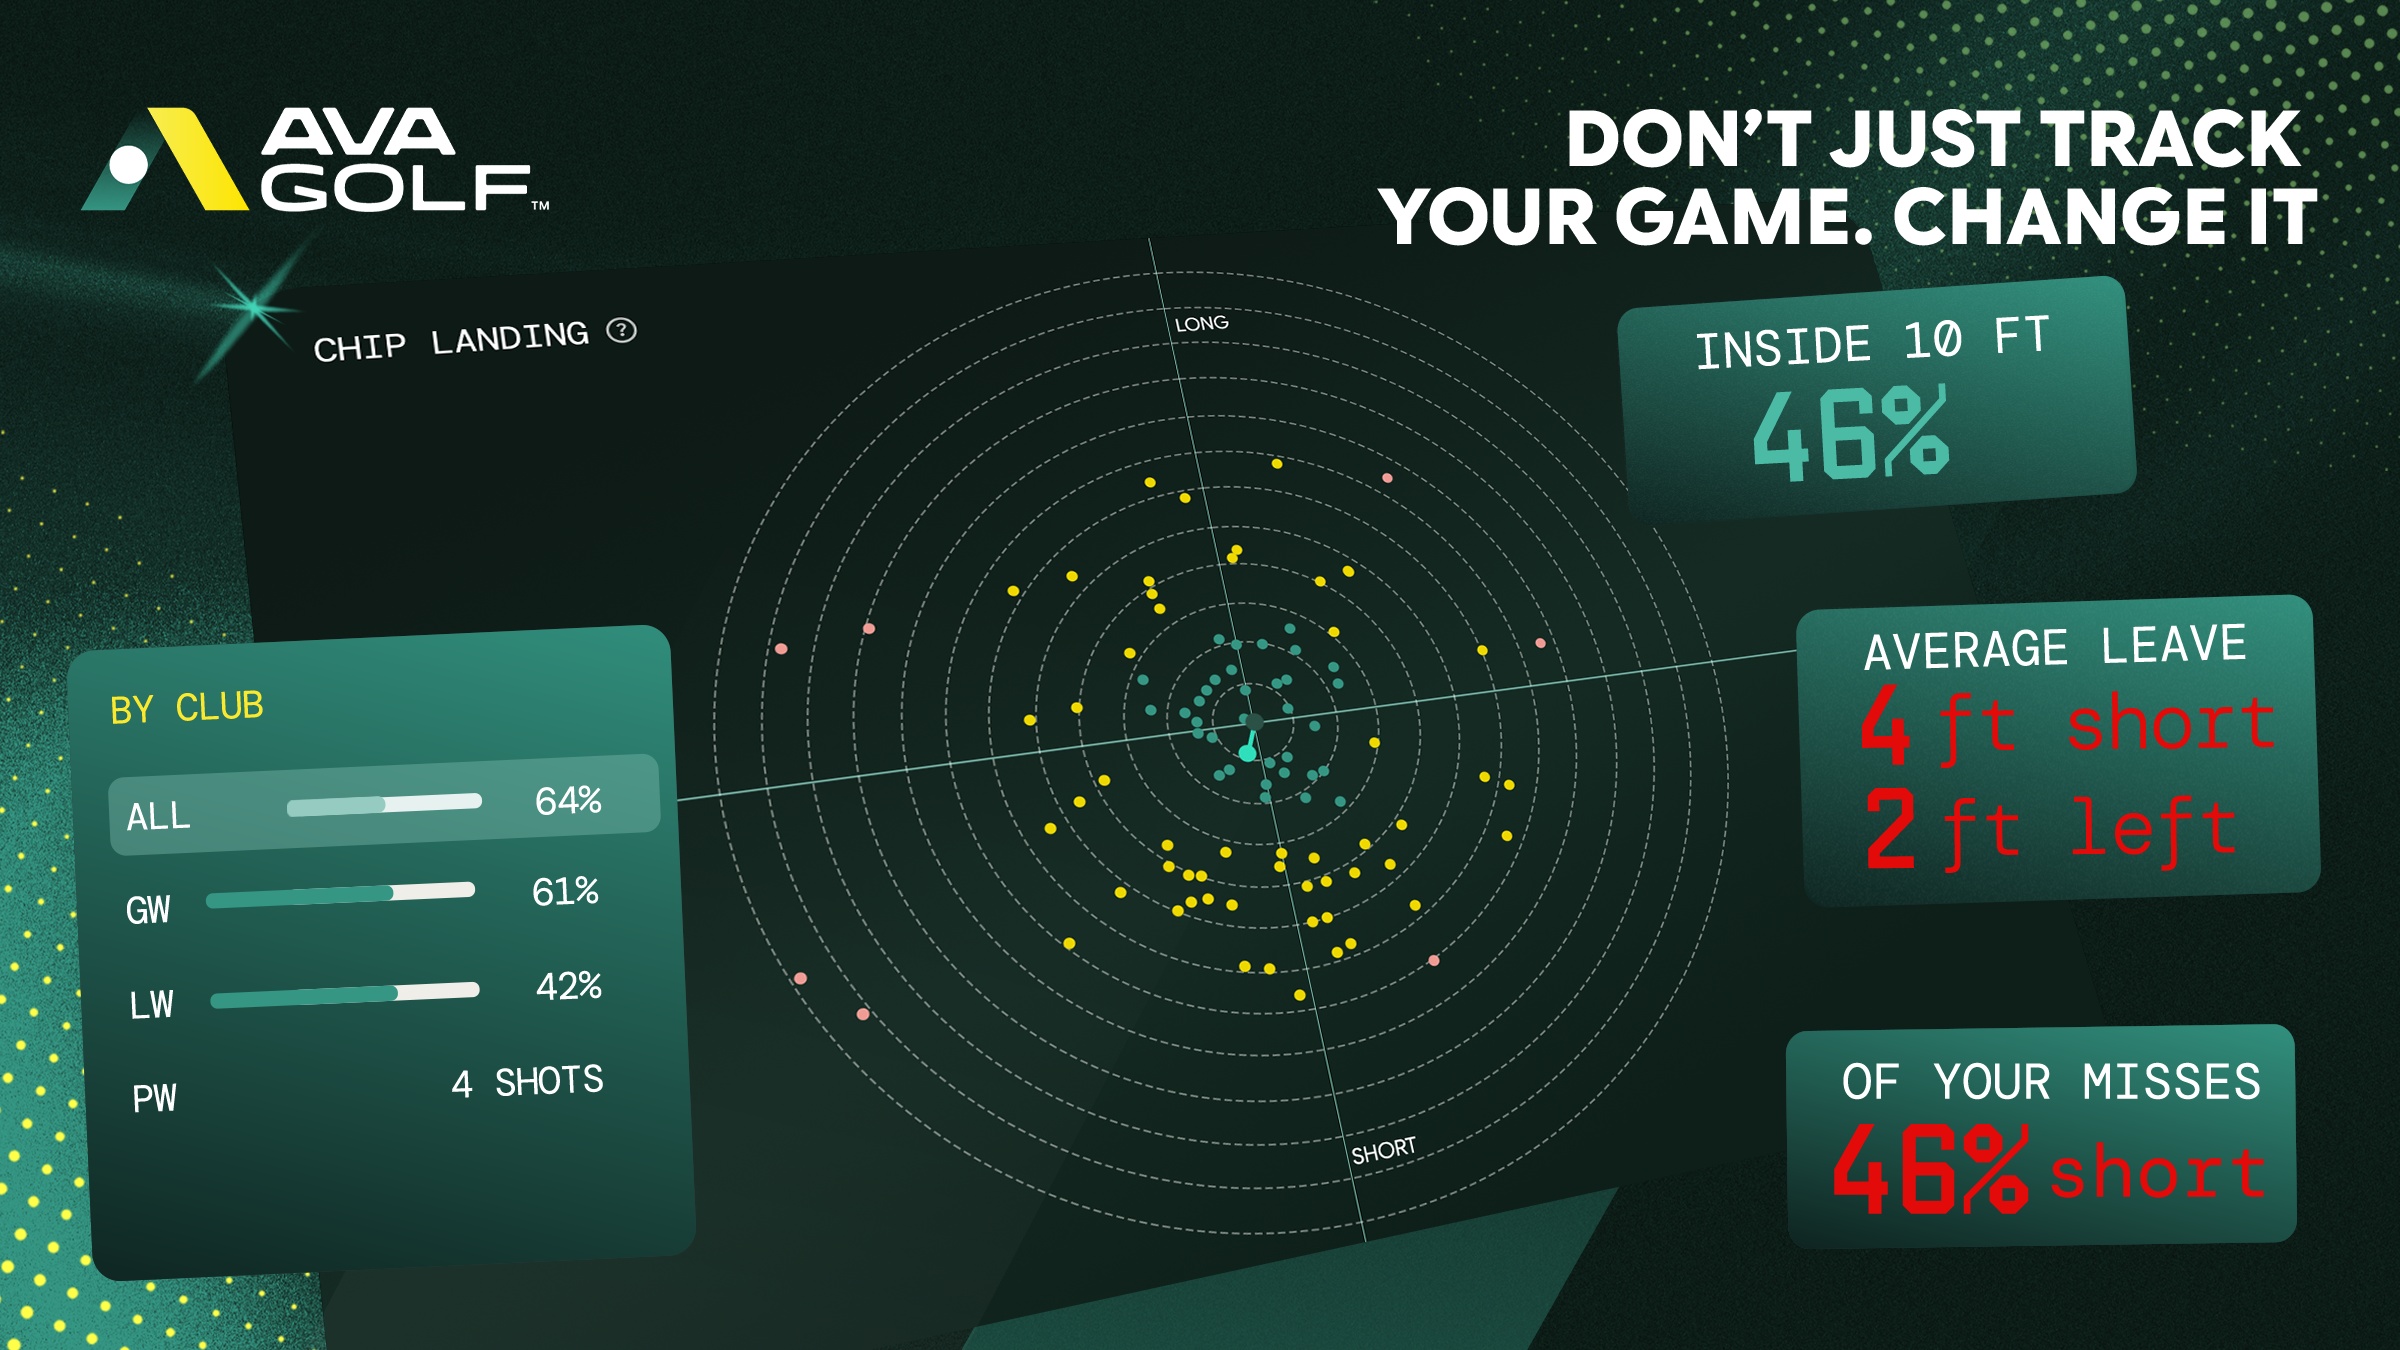
Every chip plotted by where it finished relative to the hole — green inside 10 feet, yellow from 10 to 25, red beyond 25 — so a season of short game reads at a glance.
The spread of color makes the tendency obvious: how much of it finishes short, which wedge holds up, and whether the average leave is a tap-in or a real putt.
Copy Image EmbedDownload
<img
  src="https://brand.avagolf.com/brand/application/chip-landing-chart.webp"
  alt="AVA Golf chip landing chart screen"
/>

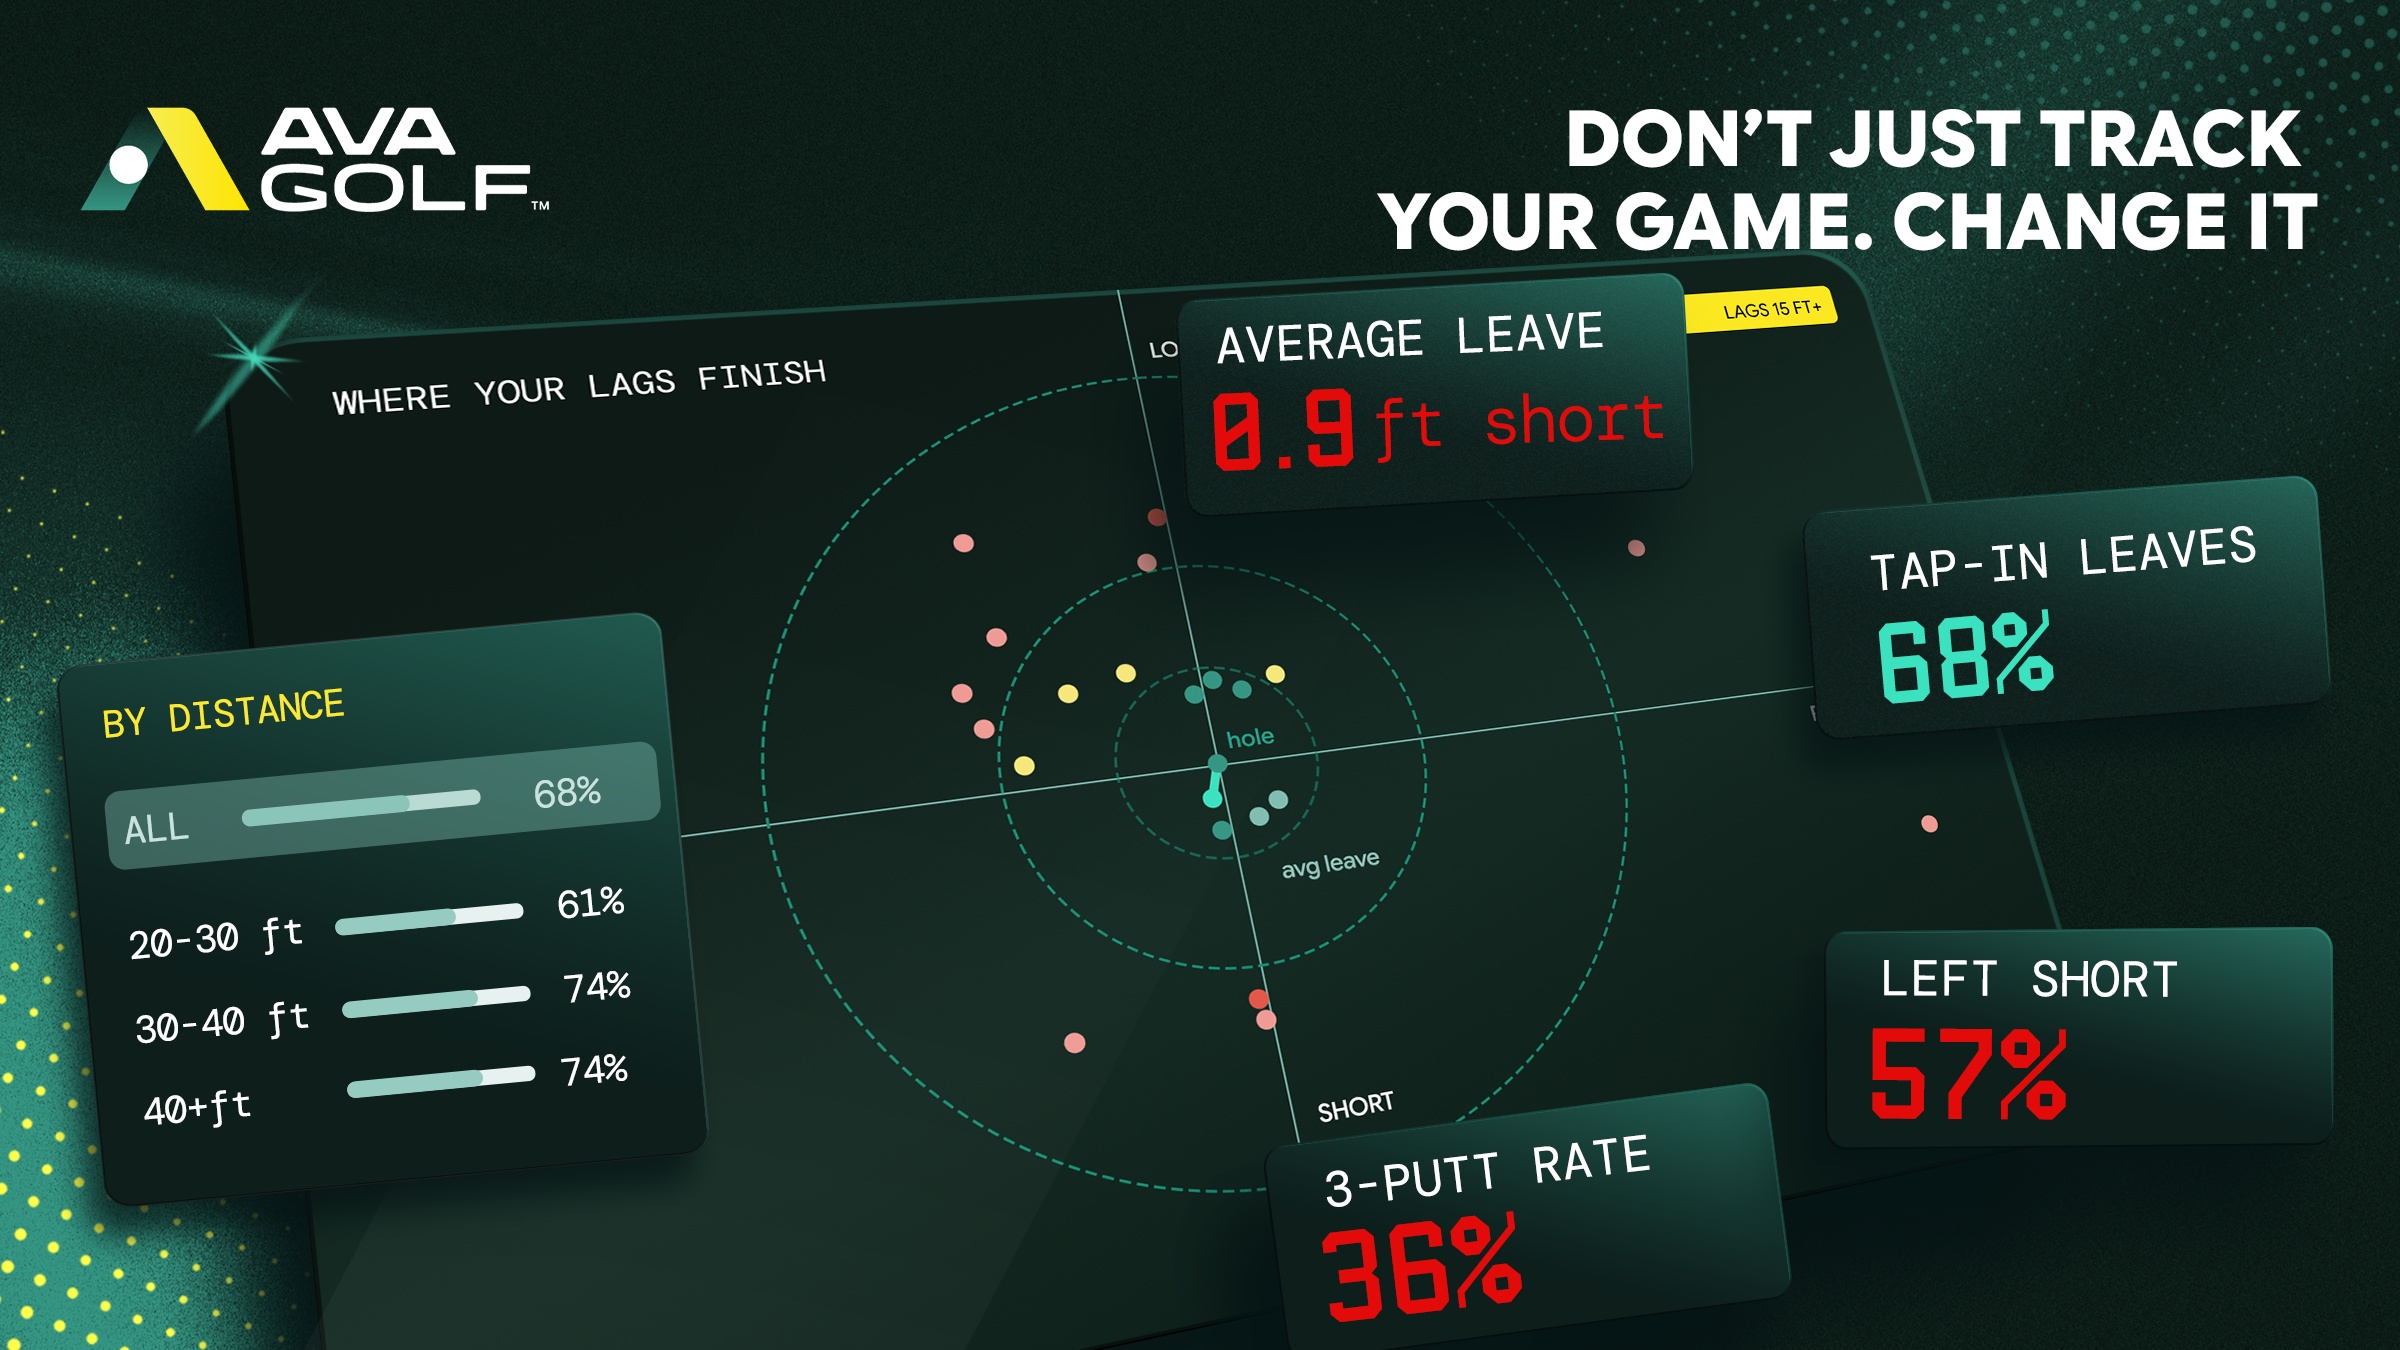
Where Lags Finish
Every lag putt from 15 feet and out, plotted by where it came to rest around the hole — the leave that decides whether the next putt is a formality or a test.
Tap-in rate by distance, the average leave, and how much of it finishes short turn a vague sense of poor speed control into the exact tendency behind the three-putts.
Copy Image EmbedDownload
<img
  src="https://brand.avagolf.com/brand/application/where-lags-finish.webp"
  alt="AVA Golf where lags finish screen"
/>
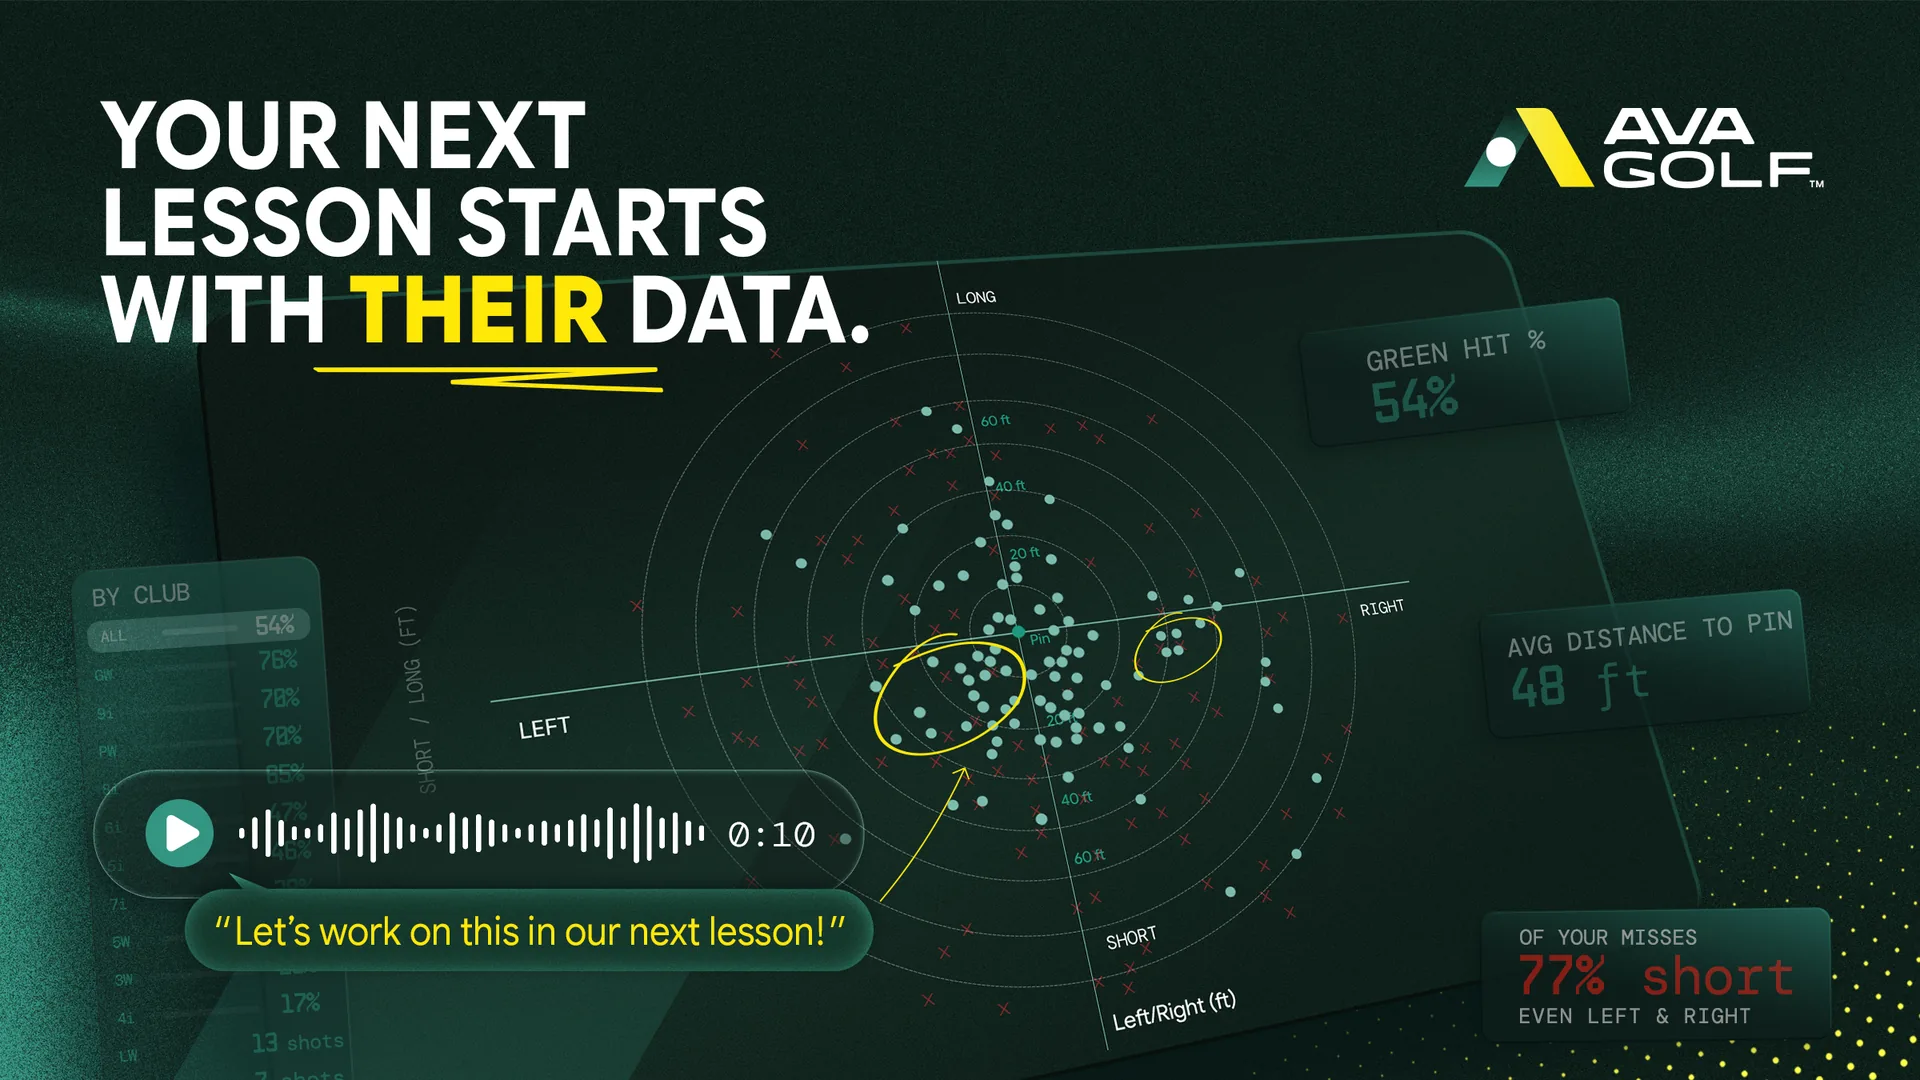
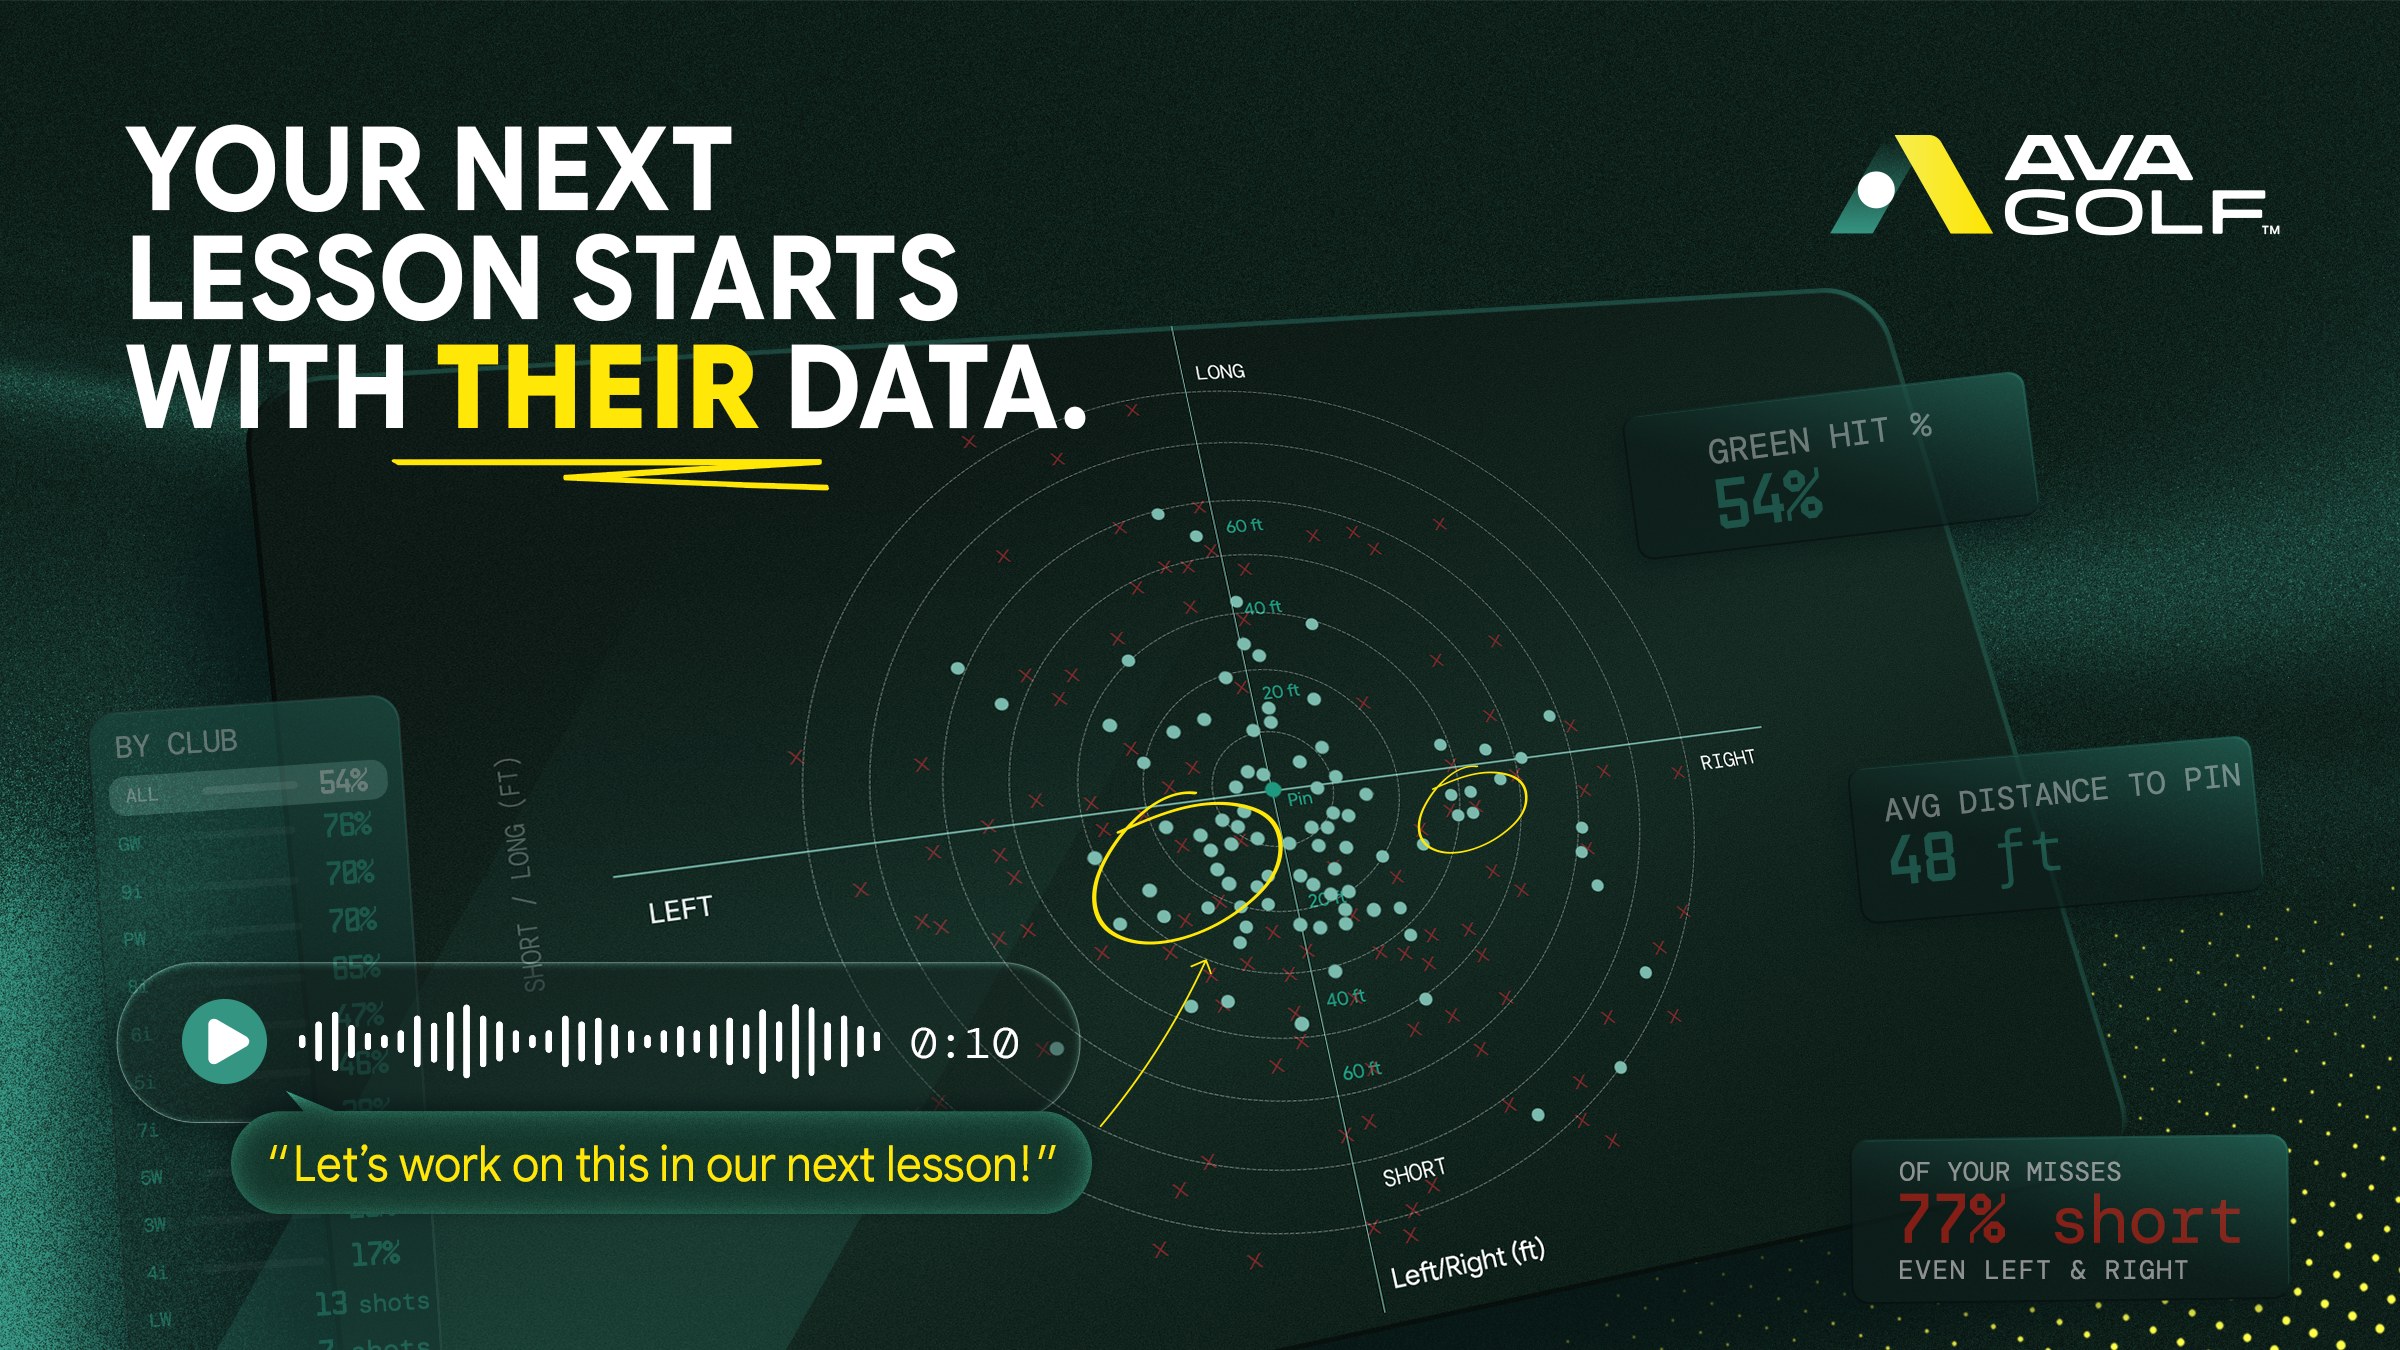
Lesson Voice Note (Approach Dispersion)
On the approach dispersion chart, the cluster of misses short and left of the pin is circled, with a coach's voice note pinned right to it — "Let's work on this in our next lesson!" — matching the read-out beside it: 54% green hit, misses running 77% short.
Rather than reacting to one approach shot or one round, the lesson starts from the pattern the dispersion chart already shows, with the coach's own note carrying that context into the next session.
Copy Image EmbedDownload
<img
  src="https://brand.avagolf.com/brand/application/lesson-voice-note-dispersion.webp"
  alt="AVA Golf approach dispersion chart with a coach's voice note callout on the cluster of misses"
/>
Lesson Voice Note (Shot Tracer)
On this hole's shot tracer, the cluster of approach shots coming up short near the pond is circled, with a coach's voice note pinned right to it — "Let's work on this in our next lesson!" — matching the strokes gained breakdown, where approach is the biggest loss at -1.82 on a hole that finished +8 to par.
The lesson starts from the exact stretch of the hole that gave strokes back, not from a generic take on a 79 — turning one round's shot history into the next session's plan.

Copy Image EmbedDownload

<img
  src="https://brand.avagolf.com/brand/application/lesson-voice-note-shot-tracer.webp"
  alt="AVA Golf hole shot tracer and strokes gained breakdown with a coach's voice note callout on a cluster of approach shots"
/>